You are here: Bode Plot
Bode Plot
|

|
This function is reserved for engineers and technicians who are experienced in control technology. As soon as the confirmation query is confirmed, movement immediately starts automatically using the internal setpoint provision !
Appropriate training is available on request.
|
With the help of the Bode plot, you can analyze and optimize the speed controller, taking into account the mechanical characteristics of the machine.
The Bode plot draws the frequency response of the speed controller. The system is stimulated by a sinusoidal input variable. The output variable has the same frequency, but a different amplitude and some degree of phase shift.
The relationship between the amplitude as a function of frequency (amplitude response) and the phase shift as a function of frequency (phase response) provides a complete description of the dynamic characteristics of the control loop
Amplitude response
The amplitude response is the frequency-dependent amplitude characteristic (gain), shown on a logarithmic scale.
Phase response
The phase response is the frequency-dependent phase-shift characteristic.
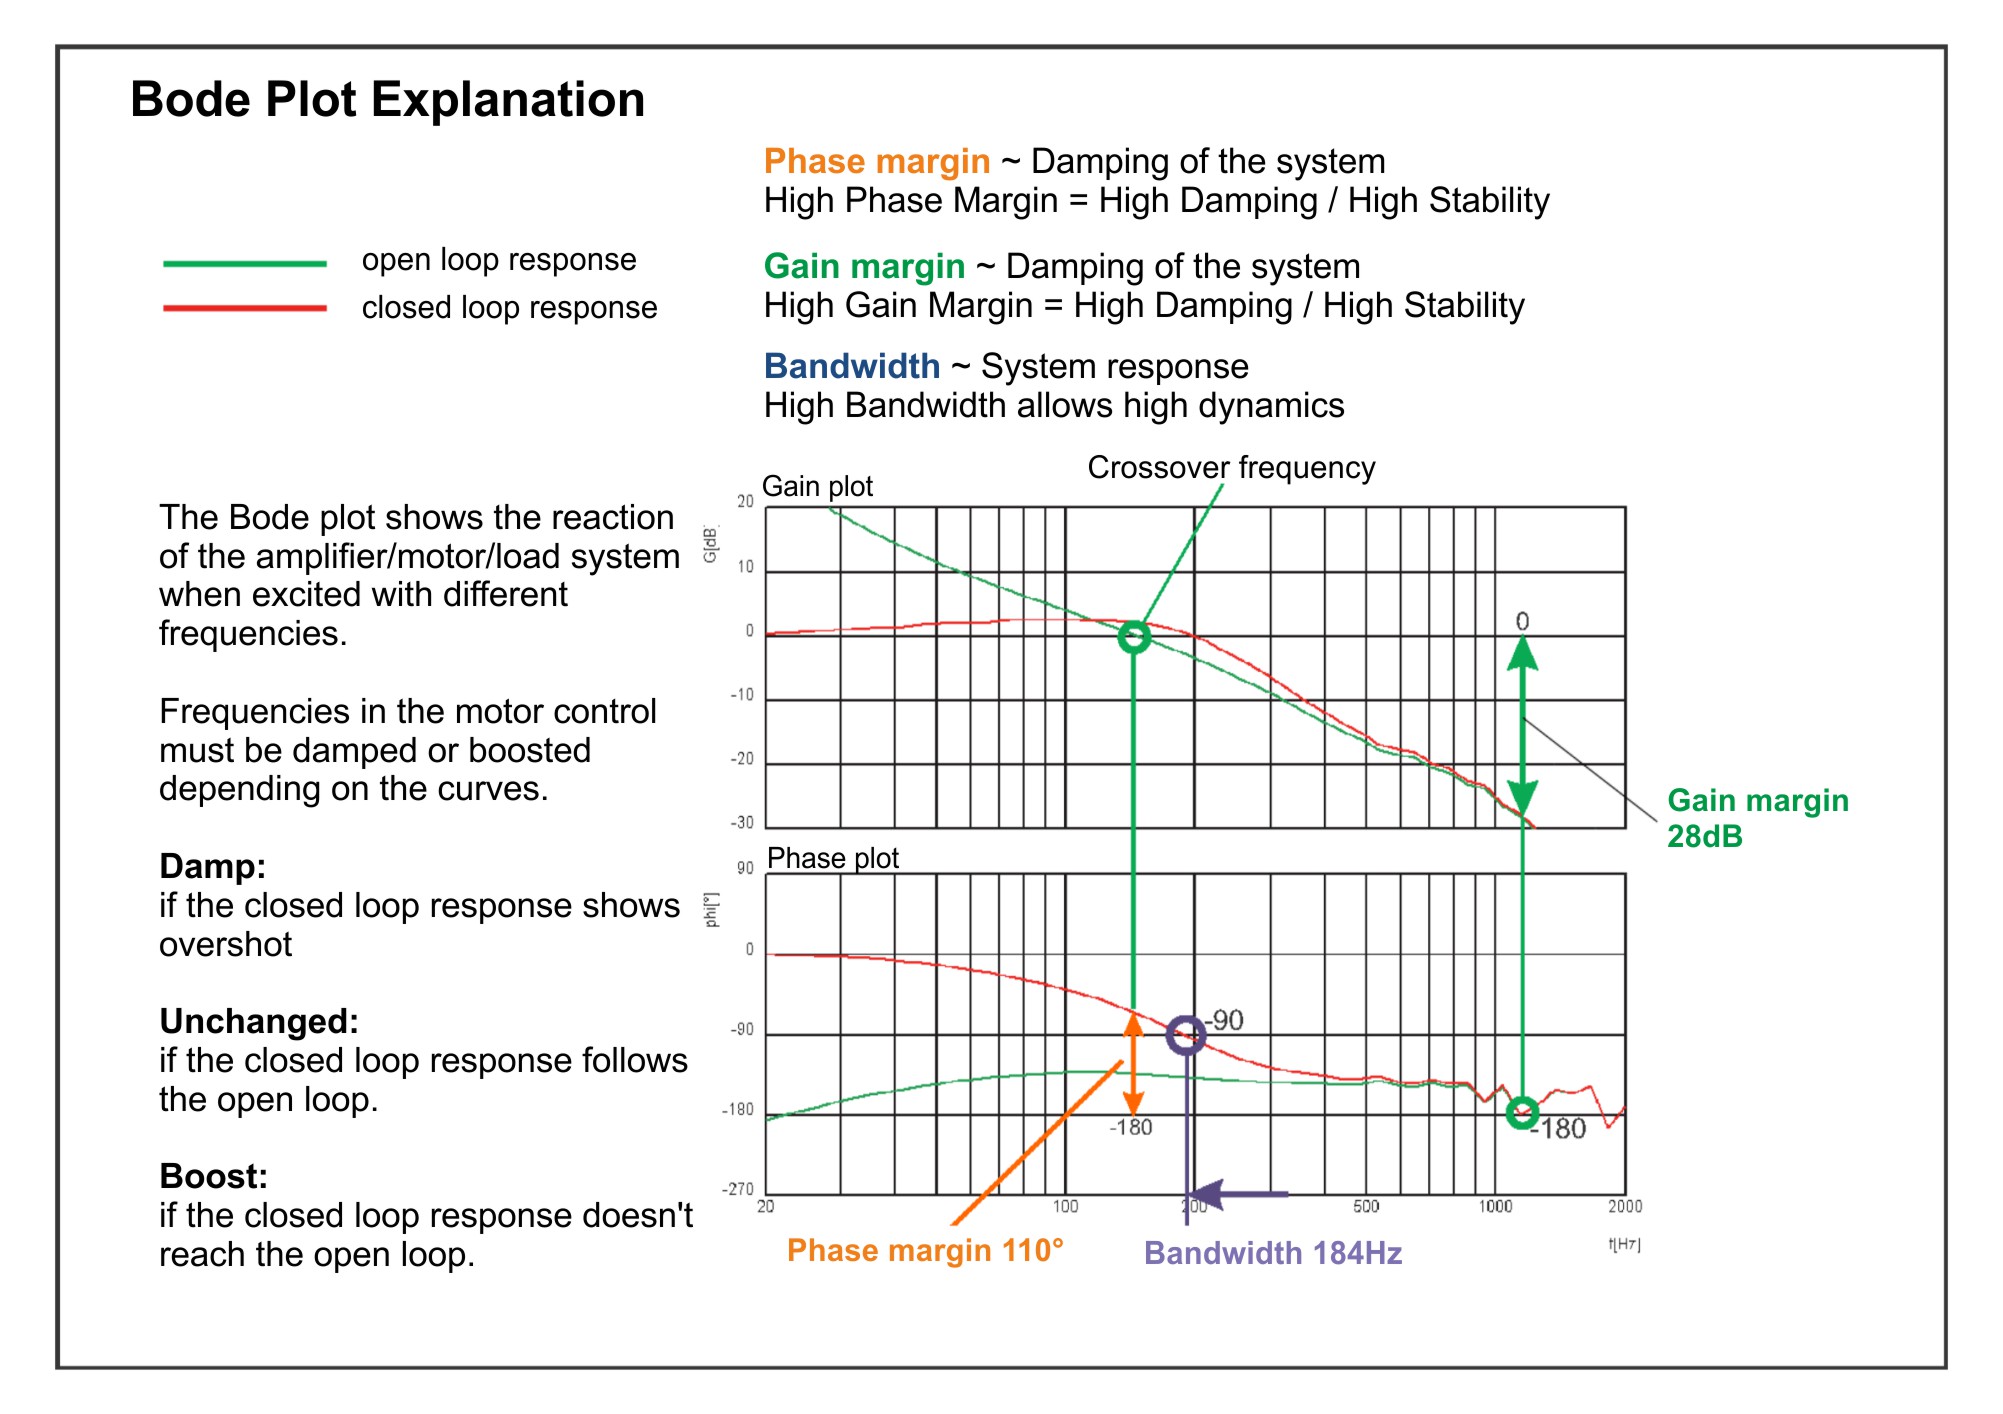
The following characteristic data are used for a qualitative description of the open loop frequency response:
Phase reserve (open loop)
The spacing between the phase characteristic curve and the -180° phase-shift line at the cut-off frequency, i.e. the frequency at which the amplitude characteristic (gain) has fallen to 0 dB.
Amplitude reserve (open loop)
The spacing between the amplitude characteristic (gain) and the 0 dB level at a phase shift of -180°
The characteristics of the closed control loop are evaluated with the aid of the Bode plot, using the expressions "bandwidth" and "peaking":
Bandwidth (closed loop)
Bandwidth is the range of frequencies limited by the frequencies where the logarithmic amplitude characteristic (gain) falls off by -3 dB.
Peaking (closed loop)
The expression "peaking" describes an overshoot of the closed control loop, corresponding to the maximum in the amplitude response.
Bode Plot
Starts recording the data.
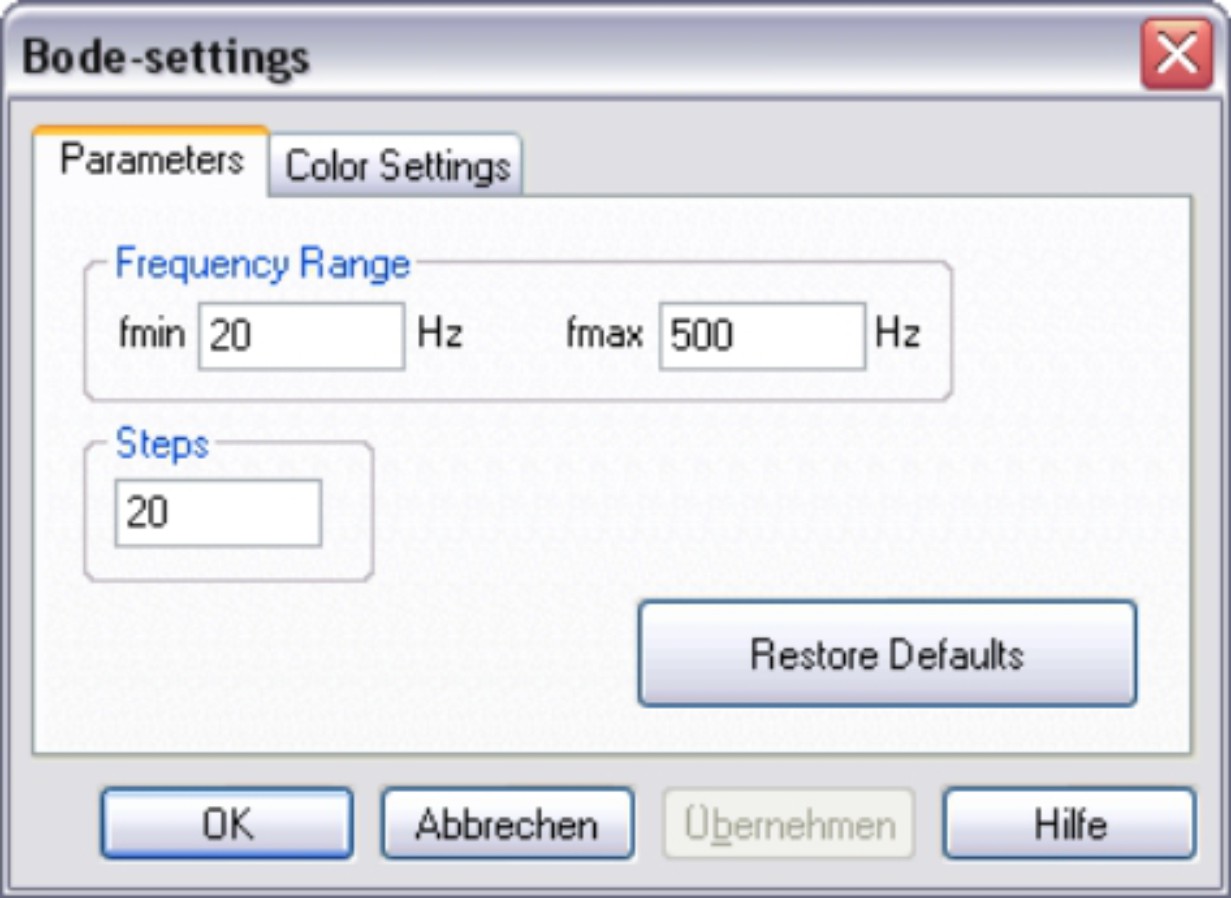
Parameter…
Call up the screen page "Bode Plot Parameter". This page is used to define the frequency range and the number of steps.
Switch Open Loop / Closed Loop or Filter Function
“Open Loop / Closed Loop”
Amplitude and phase response of the open and closed loop are displayed.
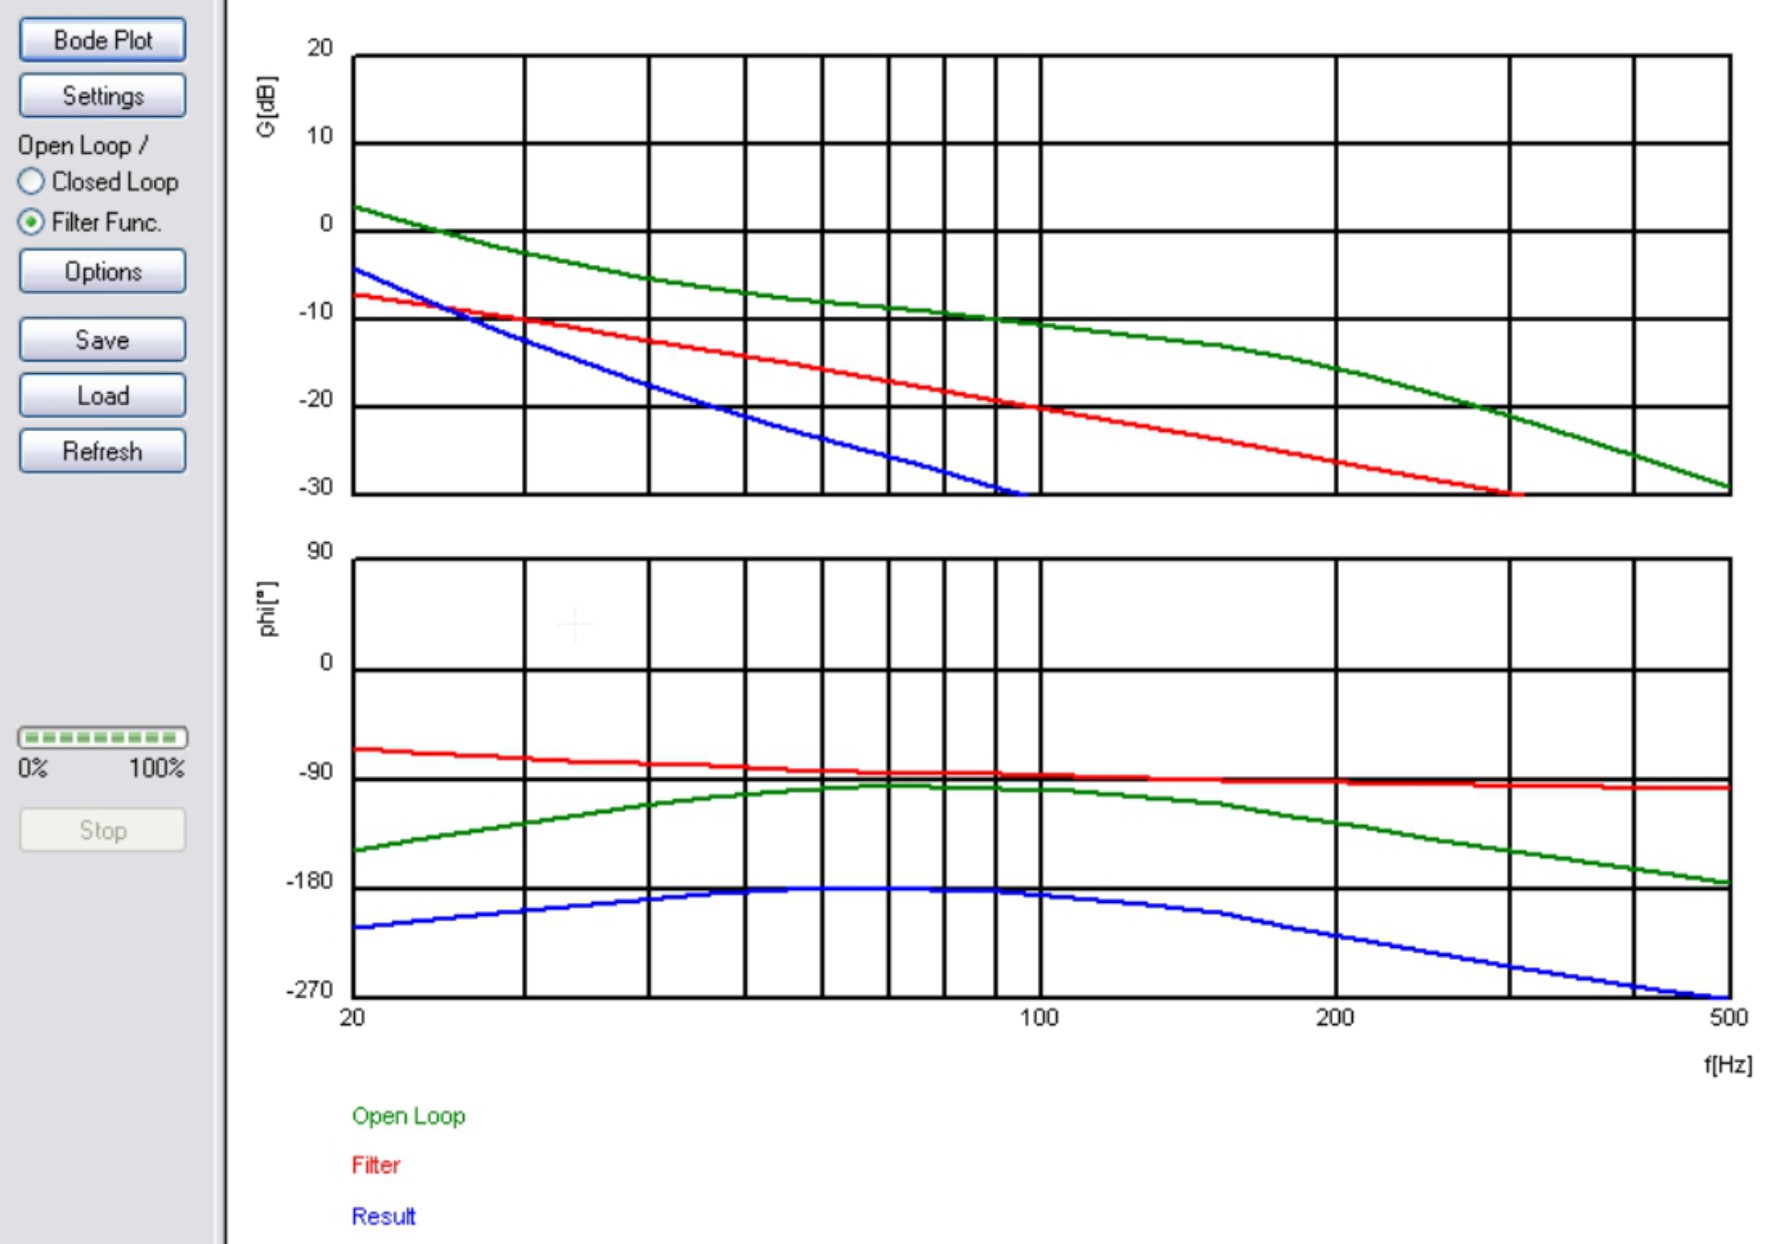
“Open Loop / Filter Function”
Displayed are amplitude and phase response
- of the open loop
- of the filter
- of the open loop incl. filter (resulting curve).
This function can be used for filter simulation.
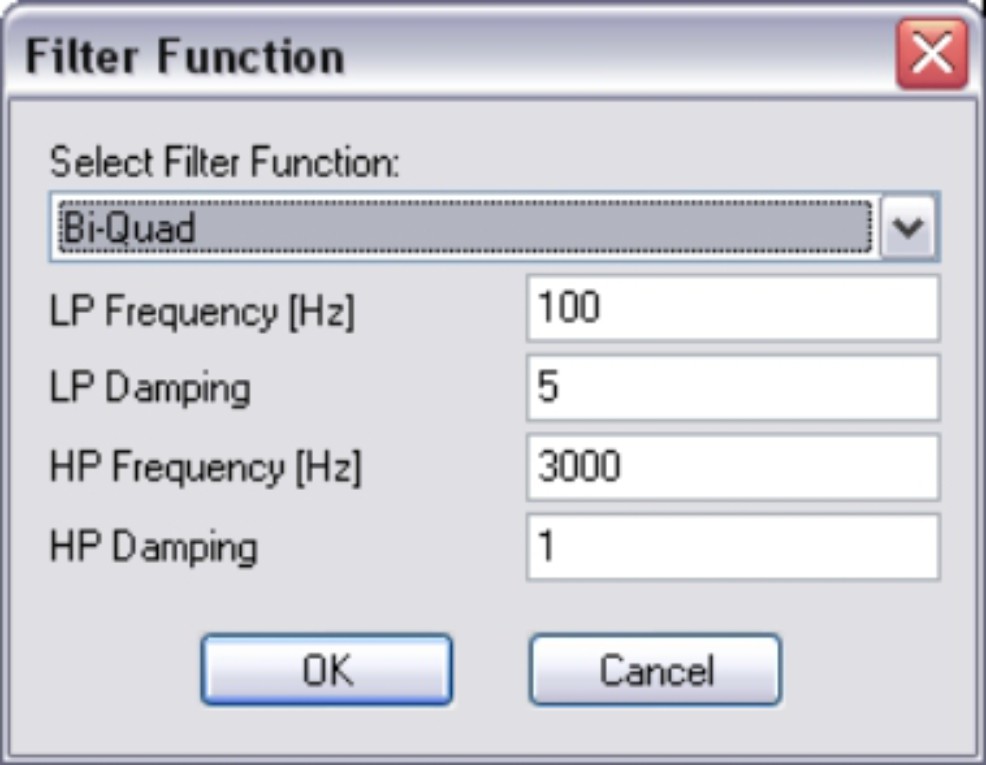
Configure (with Filter Function only)
Select the desired filter function. The filter parameters must be configured with the Terminal screen .
PID-T2 Filter
PID-T2 filters can be used effectively to reduce the torque ripple and resonances from the motor, gearbox and a coupled load. ASCII parameters for this filter:
BQMODE = 2
ARLPF - LowPass-Frequency
ARHPF - HighPass-Frequency
1. Order Low Pass
Low-pass filters are used to suppress signals of higher frequencies (e.g. resonances and noise). ASCII parameter for this filter:
ARLP2
2. Order Low Pass
Low-pass filters are used to suppress signals of higher frequencies (e.g. resonances and noise).
ASCII parameters for this filter:
ARLPF - LowPass-Frequency
ARLPD - LowPass-Damping
Bi-Quad
Bi-quad filters can be used effectively to compensate resonances in a two-mass servo system. ASCII parameters for this filter:
BQMODE = g
ARLPF - LowPass-Frequency
ARLPD - LowPass-Damping
ARHPF - HighPass-Frequency
ARHPD - HighPass-Damping
Save
Saves the measurements that were recorded to a data medium in CSV format (can be evaluated by MS-Excel).
Load
Loads a CSV file and displays the curves in a diagram.
Update
Loads and display the latest set of recorded data.
Cursor Function
When a set of data is displayed (from a file, or by starting a recording), a mouse click in the coordinate system displays the measured values for the signals at the selected time. A click outside the coordinate system sets the display values back to 0.
Example
|
|
Copyright © 2020
|
|

|


